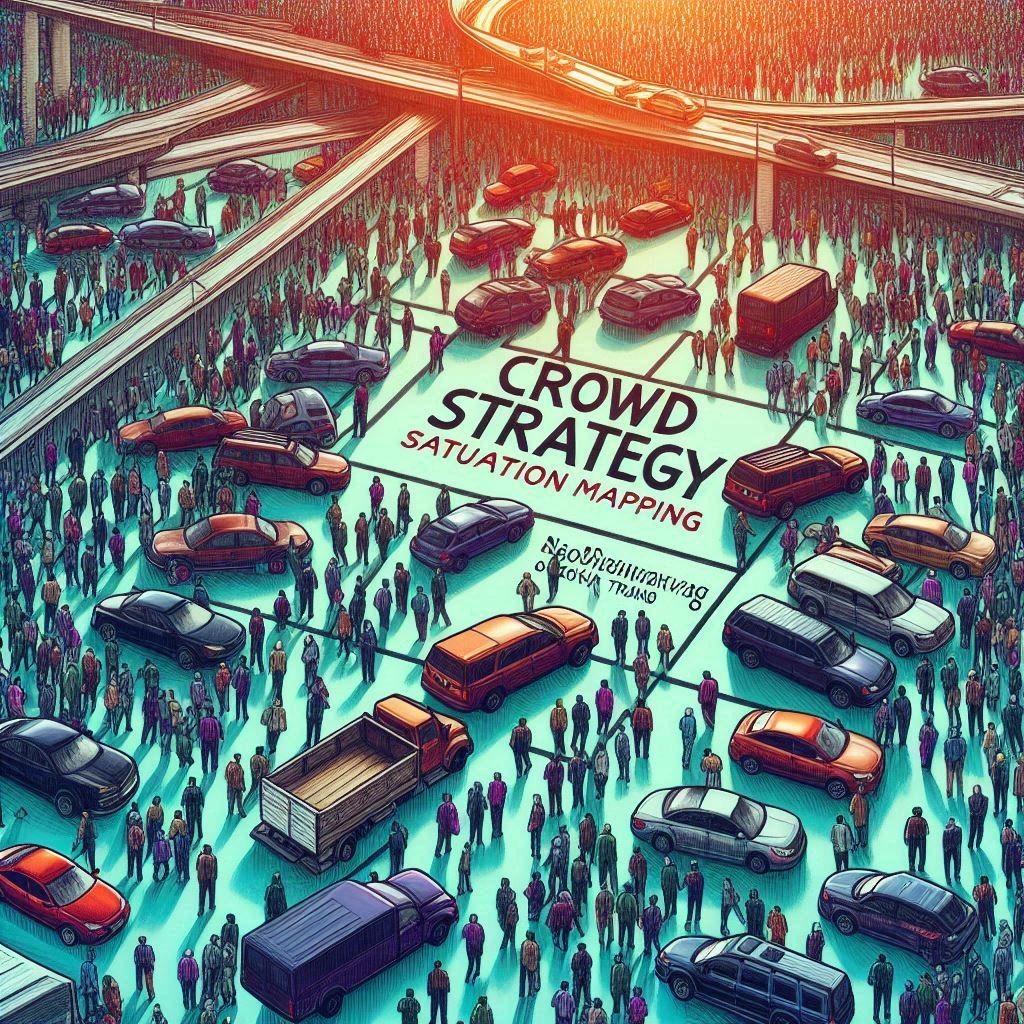
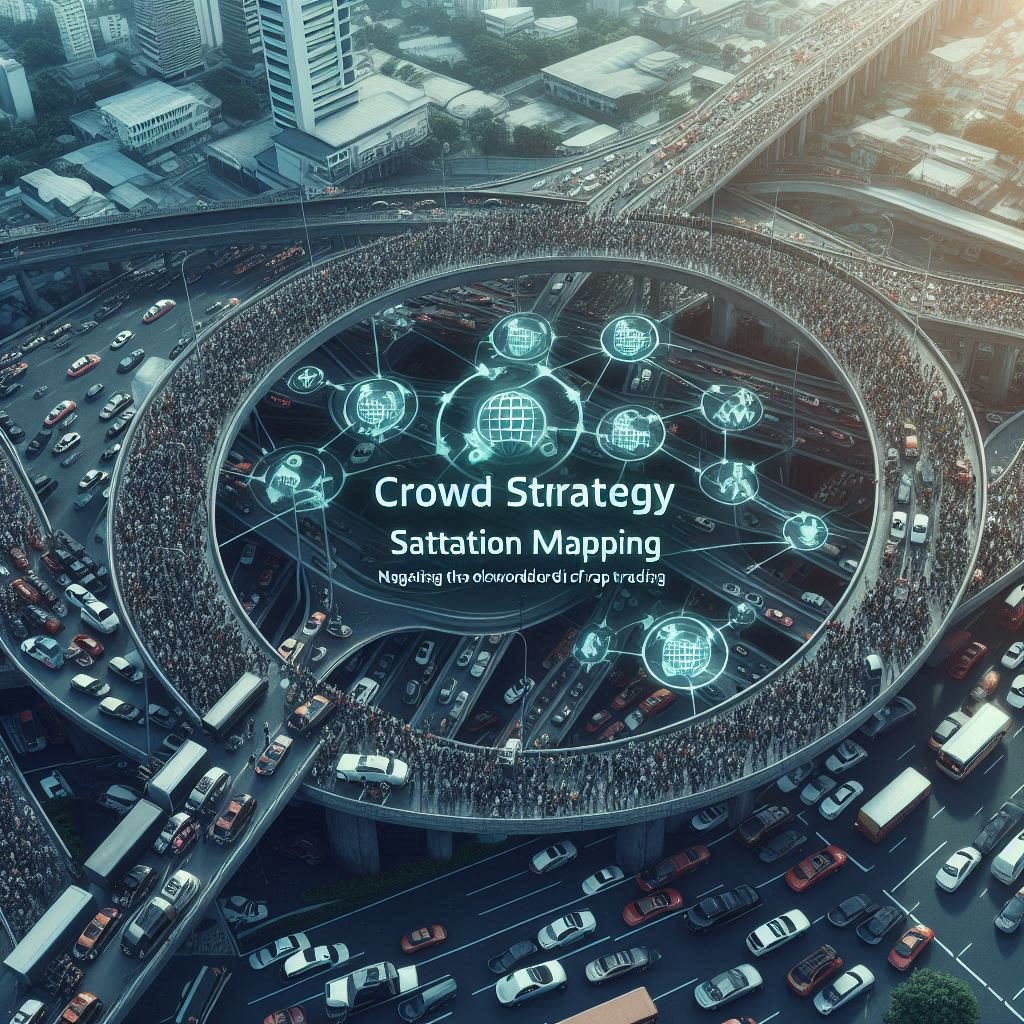
Imagine a wide-open highway at dawn — smooth asphalt, barely any traffic, and a clear path to your destination. You push the pedal and cruise effortlessly. This is what a trading strategy feels like in its early days — fresh, under-the-radar, and full of edge. But as word spreads and more drivers flood the road, that same highway becomes congested, chaotic, and dangerous.

This is the essence of Crowd Strategy Saturation — and mapping it is one of the most underappreciated arts in proprietary trading.
In the world of prop trading, where thousands of sharp minds are hunting for inefficiencies in the same data sets, no edge lasts forever. Strategies are born in obscurity, rise to popularity, and eventually die from overcrowding. Crowd Strategy Saturation Mapping is the systematic process of identifying when a trading strategy has become so widely adopted that it loses its profitability — and potentially even becomes a liability.
The Lifecycle of a Strategy
Every strategy has a lifecycle, and in prop trading, that cycle can be brutally short. A once-brilliant idea — say, a volatility arbitrage model — might work beautifully when a handful of desks are using it. But as the signal becomes obvious, capital floods in, spreads tighten, slippage increases, and what was once alpha turns into beta — or worse, into risk.
Think of it like a hidden fishing spot in a quiet village. At first, only a few skilled anglers know of it, pulling in fat, gleaming fish every morning. Then someone posts it online. Suddenly, tourists arrive with nets and coolers.
This is the tragedy of crowding — and prop trading firms must learn not only to spot these signs early but to map them continuously.
The Tools of the Mapper
Crowd Strategy Saturation Mapping isn’t done with a compass and paper — it’s done with data, inference, and intuition. In a prop trading environment, it often includes:
- Trade density analysis – How many market participants are targeting the same price levels or reacting to the same signals?
- Order book behavior – Are there unnatural clusters of orders that suggest bots are crowding a known edge?
- Slippage tracking – Is execution quality deteriorating even though the model remains statistically valid?
- Regime detection – Has volatility structure or liquidity profile changed due to crowd behavior?
The goal is to detect the invisible traffic jam before your engine overheats.

Herd Behavior and the Mirage of Safety
One of the great paradoxes in prop trading is that when more people use a strategy, it can feel safer — even as it becomes more dangerous. But when liquidity evaporates or the market regime flips, crowded strategies unwind violently. Those at the back of the herd survive; those at the front get trampled.
Mapping saturation helps prop traders stay ahead of this curve. It’s the equivalent of watching weather radar before a road trip — knowing not only where traffic is now, but where storms may form.
The Edge in Avoiding the Crowd
In a world where execution speed is measured in microseconds and alpha is a fleeting commodity, prop trading is no longer just about finding edges — it’s about knowing when those edges are dulling. The savvy desk isn’t just building strategies; it’s monitoring their saturation, exit points, and mutation paths.
Sometimes, the best trade isn’t taking a new position — it’s stepping away from the crowded one.
Crowd Strategy Saturation Mapping is more than a risk control tool. It’s a navigational compass in the dense fog of modern markets. For proprietary trading firms, it represents an evolved mindset — one that doesn’t just hunt alpha, but tracks its decay.
Because in prop trading, as in war and traffic, survival often comes down to knowing when not to follow the crowd.


